Abstract
Real-time Pacific Ocean monitoring and multi-model ensemble forecasts indicate that a strong Eastern Pacific (EP) El Niño event is developing in 2026, with the Oceanic Niño Index (ONI) projected to cross the +2.5°C "very strong" threshold by August 2026. This report examines the distinct seasonal hydroclimatic risks that EP El Niño imposes on three agricultural and hydrological regions of Thailand — the Khorat Plateau, the Chao Phraya Basin, and Northern Thailand — using ERA5 reanalysis composites detrended against a 1991–2020 climatology. The central finding is that the sharpest agricultural risk does not coincide with the developing monsoon of 2026, but rather with the post-peak hot season of March–May 2027, when suppressed rainfall, elevated temperatures, and depleted antecedent storage combine to maximum effect. The EP–CP contrast is substantial: over the Khorat Plateau, EP El Niño produces a March–May rainfall anomaly of −133 mm and a temperature anomaly of +1.27°C above the already-warm CP composite, versus a CP anomaly of only −17 mm and +0.25°C. These findings carry direct implications for cassava establishment timing, Chao Phraya reservoir management, and northern Thailand fire and heat advisories.
Khorat Plateau · EP · Mar–May
Khorat Plateau · EP · Mar–May
Chao Phraya · CP · Sep–Nov
(recharge risk)
El Niño and Southeast Asian Climate Risk
El Niño–Southern Oscillation (ENSO) is the dominant mode of interannual climate variability in the tropical Pacific and a primary driver of seasonal rainfall and temperature anomalies across Southeast Asia. During El Niño events, suppression of convection over the Maritime Continent and the Indochina Peninsula typically produces below-normal monsoon rainfall and above-normal temperatures across Thailand, with implications for rainfed agriculture, reservoir management, and drought risk.[1,2]
A now well-established body of literature has shown, however, that El Niño is not a single teleconnection pattern. Two primary types — Eastern Pacific (EP) El Niño and Central Pacific (CP) El Niño, the latter also called El Niño Modoki or dateline El Niño — differ substantially in their Pacific SST structure, atmospheric feedbacks, and downstream climate impacts.[3,4,5] The distinction between these two types has been recognized since at least the early 2000s,[6] but its operational application to Thai agricultural and water management advisories remains limited.
The motivation for this report is twofold. First, current forecast systems indicate that the developing 2026–27 event carries a clear EP signature — a pattern historically associated with more severe post-peak drying and heat over the Khorat Plateau and Chao Phraya Basin than CP events produce. Second, the conventional framing of El Niño risk — focused on the developing monsoon season — may systematically mistime the peak danger for Thai agriculture, which historical EP composites locate in the post-peak March–May window.
This report focuses on three agricultural and hydrological regions: the Khorat Plateau (15–18°N, 101–105°E), the Chao Phraya Basin (14–17°N, 99–101°E), and Northern Thailand (16–20°N, 98.5–101°E). Monthly ERA5 0.5° regional averages are sourced from Climate Reanalyzer. All anomalies are detrended by calendar month against a 1991–2020 climatology.
Two Flavors, Fundamentally Different Teleconnections
The canonical EP El Niño places its SST anomaly maximum in the eastern equatorial Pacific, in the Niño 3 region (5°N–5°S, 150°W–90°W), and is associated with intense deep convective heating that drives a strongly asymmetric Walker circulation response.[3] The CP El Niño, by contrast, concentrates its warming near the dateline in the Niño 4 region (5°N–5°S, 160°E–150°W), producing a weaker and differently positioned atmospheric response that shifts the downstream teleconnection pattern substantially compared with EP events.[4,5]
Hu, Yang, and Cai[3] provide a comprehensive physical characterization of the two types for the post-1979 period, showing that EP events (they identify major EP winters including 1982–83, 1986–87, 1997–98, and 2006–07) and CP events (including 1994–95, 2002–03, 2004–05, and 2009–10) differ in SST structure, thermocline feedbacks, and atmospheric bridge pathways. Their analysis underscores that classification is method-sensitive — particularly around events of intermediate character — but the structural distinction is physically robust.
An important trend in the observational record is the apparent increase in CP El Niño frequency since the mid-1990s, which some studies attribute to long-term tropical Pacific mean-state warming.[7,8] This shift means that pre-1990s El Niño climatologies — which are dominated by canonical EP events — may overestimate CP rainfall impacts, and vice versa. For Thailand, this has a practical implication: advisories trained on older composites may be miscalibrated for the current period's mix of event types.
"Pooling EP and CP events in a composite can weaken or entirely obscure regional teleconnection signals that are large and consistent within each type separately."
— After Kingtse Mo, NOAA/CPC; cf. [6]
For North America, Larkin and Harrison[6] demonstrated that what they called "dateline" El Niño events produced different winter climate impacts than canonical events, and that pooled composites were misleading. Subsequent global analyses have confirmed that the land temperature and precipitation response differs substantially between EP and CP El Niño across multiple regions, with model projections suggesting these contrasts may intensify under continued warming.[9]
Asian teleconnection pathways
For East Asia, recent work has shown that EP and CP El Niño produce distinct summertime precipitation extremes during the decay phase, associated with different Walker and Hadley circulation responses involving the South Asia High, the upper-tropospheric westerly jet, and the western Pacific subtropical high.[10] For South China, EP and CP events produce different late-autumn to winter precipitation structures, linked to differing equatorial SST gradients and downstream circulation pathways.[11]
For mainland Southeast Asia and Thailand specifically, the EP–CP distinction in the agricultural literature is less developed than for East Asia, but the physical logic is clear: the farther east the SST anomaly sits, the stronger the Walker circulation perturbation, and the more strongly suppressed convection becomes over the Indochina Peninsula during the developing and peak phases — and the stronger the post-peak anomaly that persists as the event decays.
Forecast Character and EP Classification
As of April–May 2026, multiple lines of monitoring evidence point toward a developing EP El Niño event of potentially strong to very strong intensity. The Oceanic Niño Index (ONI), based on a 3-month running mean of Niño 3.4 SST anomalies, stood at approximately +0.13°C in March 2026 — technically neutral — but with the underlying Niño 3 index already running at +0.80°C, substantially warmer than the Niño 4 index at +0.10°C. This Niño 3 > Niño 4 configuration is a diagnostic indicator of eastward-displaced, EP-type warming rather than CP-type warming centered near the dateline.
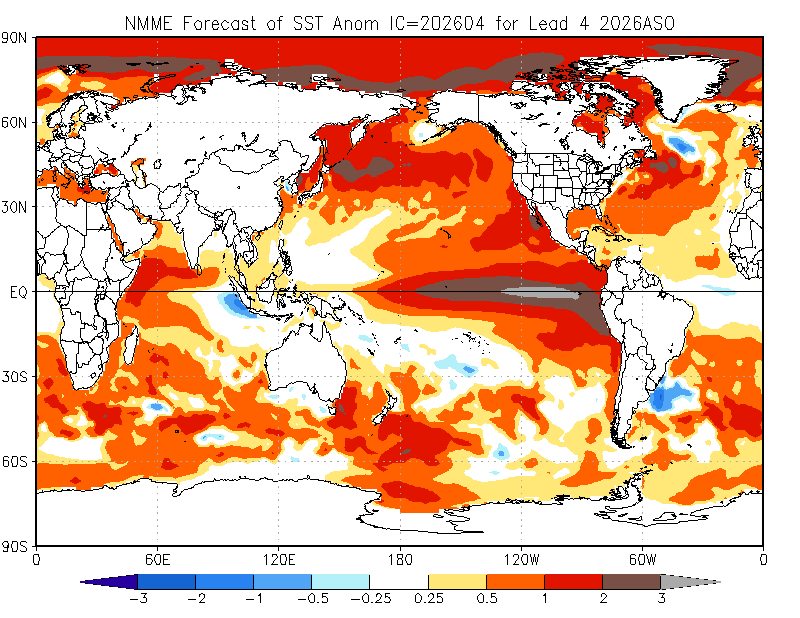
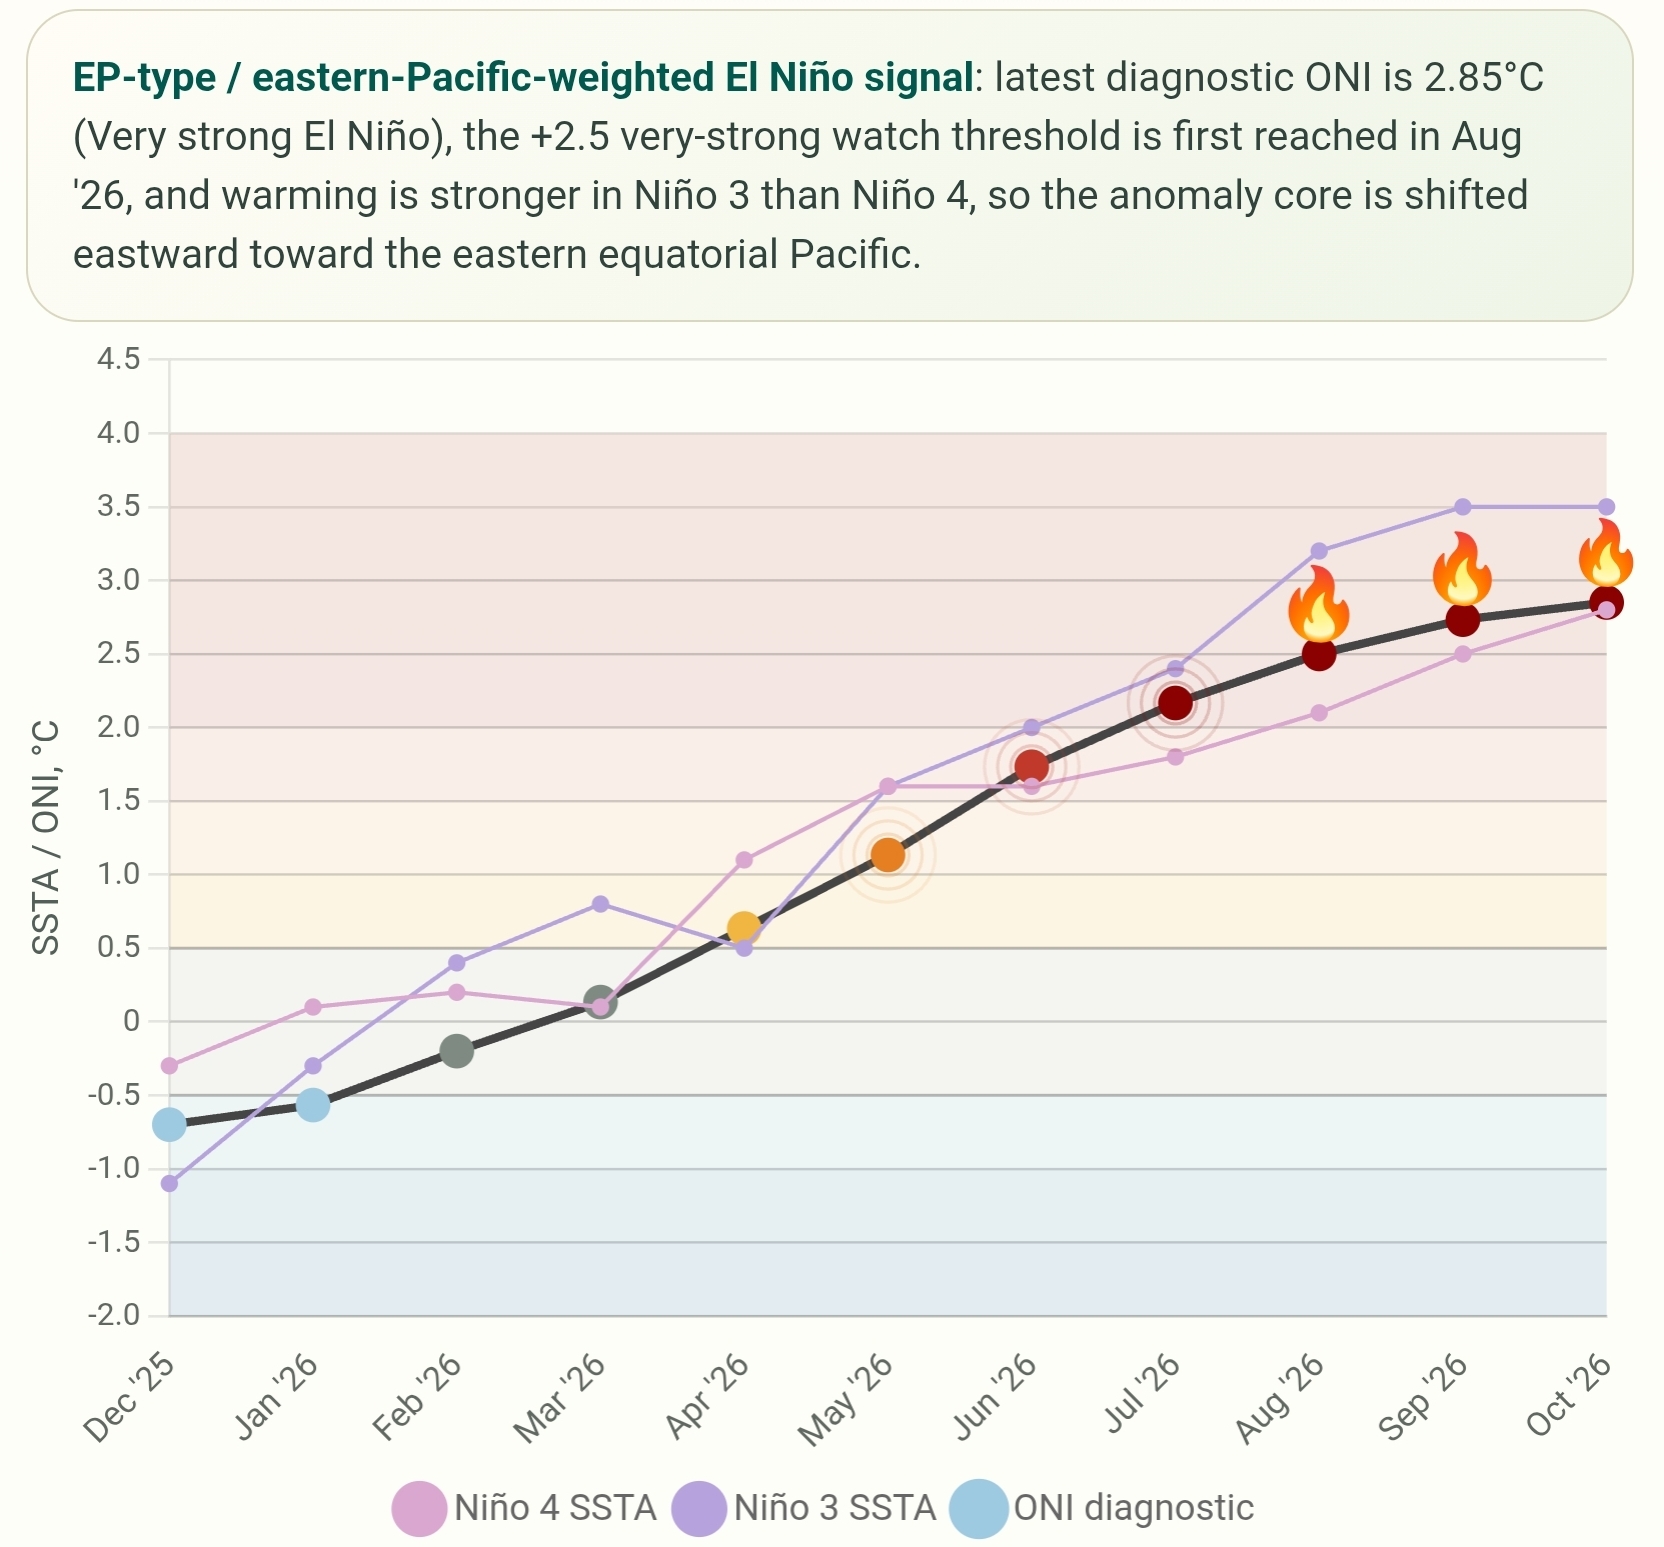
The NMME forecast for the ASO 2026 season (Figure 1) confirms the EP character at the multi-model level, with the strongest positive anomalies anchored east of 150°W. This positions the 2026–27 event in the same EP lineage as the three "clean" post-1979 EP cases used in the composites below: 1982–83, 1997–98, and 2015–16. All three of those events produced ONI peaks exceeding +2.0°C and generated well-documented agricultural and hydrological impacts across Thailand.
EP/CP classification is method-sensitive, particularly for events of intermediate magnitude. The KUCCI diagnostic uses the Niño 3 vs. Niño 4 contrast as a primary discriminator, consistent with the approach of Hu, Yang, and Cai [3]. However, the event character could evolve toward a more mixed or even CP-dominant configuration as the event matures. Regular monitoring of the Niño 3/Niño 4 ratio through the development phase (June–November 2026) is essential for calibrating the impact outlook presented here.
Different Regions, Different Risk Timing
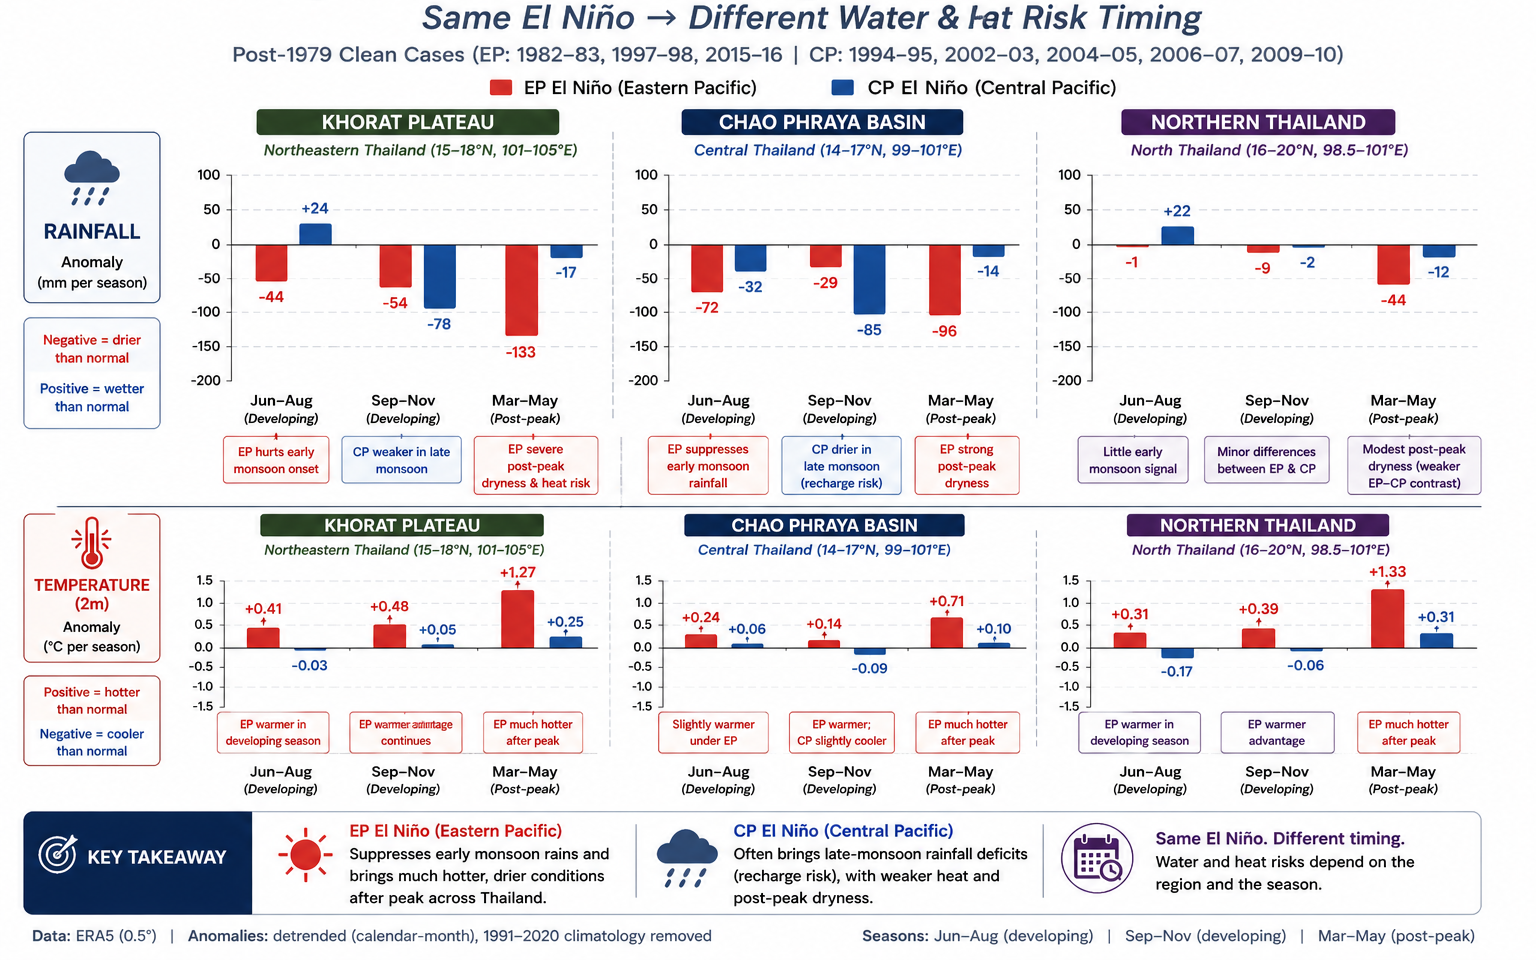
Figure 3 presents the core empirical result of this assessment: ERA5-based precipitation and 2-m temperature composites for post-1979 EP and CP El Niño events across three Thai regions. The composites are structured around three seasonal windows — June–August (JJA, developing), September–November (SON, developing late monsoon), and March–May (MAM, post-peak) — that capture the key phases of agricultural and hydrological exposure.
4.1 Khorat Plateau — Compound hot–dry carryover risk
The Khorat Plateau (15–18°N, 101–105°E) shows the clearest and most agriculturally consequential EP–CP contrast in the post-1979 composite. The developing JJA season under EP El Niño produces a rainfall anomaly of approximately −44 mm — meaningful suppression of early monsoon onset — while CP El Niño produces a positive anomaly of +24 mm over the same period. This +68 mm EP–CP contrast in the early monsoon has direct implications for cassava establishment, which depends on soil moisture availability in May–July for root penetration and early tuber initiation.
The sharpest signal, however, emerges in the post-peak MAM season. Under EP El Niño, the Khorat Plateau receives approximately 133 mm less rainfall than the climatological mean for the March–May period — a deficit that, combined with a temperature anomaly of +1.53°C, produces an evaporative demand substantially in excess of available soil water. Under CP El Niño, the same MAM window produces only −17 mm rainfall anomaly and +0.25°C temperature anomaly. The EP–CP contrast in MAM rainfall is thus approximately −116 mm, and in MAM temperature approximately +1.27°C.
| Season | Variable | EP Anomaly | CP Anomaly | EP–CP Contrast |
|---|---|---|---|---|
| JJA (Developing) | Precipitation (mm) | −44 | +24 | −68 |
| SON (Late monsoon) | Precipitation (mm) | −54 | −78 | +24 |
| MAM (Post-peak) | Precipitation (mm) | −133 | −17 | −116 |
| JJA (Developing) | Temperature (°C) | +0.41 | −0.03 | +0.44 |
| SON (Late monsoon) | Temperature (°C) | +0.48 | +0.05 | +0.43 |
| MAM (Post-peak) | Temperature (°C) | +1.53 | +0.25 | +1.27 |
Table 1. Khorat Plateau composite anomalies, post-1979 EP and CP El Niño cases. EP cases: 1982–83, 1997–98, 2015–16. CP cases: 1994–95, 2002–03, 2004–05, 2006–07, 2009–10. Source: ERA5 0.5°, detrended vs 1991–2020 climatology. Temperature values from Figure 3 lower panels; note that the +1.27°C figure in Figure 3 represents the EP composite anomaly above the CP composite, not the absolute EP anomaly (EP absolute = +1.53°C).
A longer sensitivity analysis using post-1940 data weakens the magnitude of the MAM contrast — EP −59 mm vs. CP −11 mm — but preserves the direction. The EP temperature signal in MAM is similarly robust in sign across the longer record (EP +0.92°C vs. CP +0.43°C in the post-1940 composite), though reduced in amplitude. This suggests that the EP hot–dry carryover signal over Khorat is not an artifact of the small post-1979 EP sample, but reflects a physically consistent teleconnection pathway.
4.2 Chao Phraya Basin — A two-window water management problem
The Chao Phraya Basin (14–17°N, 99–101°E) presents a more operationally nuanced picture. Both EP and CP El Niño suppress early monsoon rainfall in the JJA developing season — EP more strongly (approximately −72 mm) than CP (approximately −32 mm). This divergence creates an early-season water management signal: EP El Niño frontloads the stress on reservoir inflows during the period when storage is most rapidly accumulating.
In the SON late-monsoon window, the contrast reverses. CP El Niño produces approximately −85 mm rainfall anomaly over the basin, compared with only −29 mm under EP. This is the single largest EP–CP reversal in the composite, and it is hydrologically critical: September–November is the final high-inflow period before the dry season begins. If SON inflows are depressed — as they systematically are under CP El Niño — major reservoirs including Bhumibol and Sirikit Dam may enter the dry season below target storage.
| Season | Variable | EP Anomaly | CP Anomaly | EP–CP Contrast |
|---|---|---|---|---|
| JJA (Developing) | Precipitation (mm) | −72 | −32 | −39 |
| SON (Late monsoon) | Precipitation (mm) | −29 | −85 | +56 |
| MAM (Post-peak) | Precipitation (mm) | −96 | −14 | −82 |
| MAM (Post-peak) | Temperature (°C) | +0.71 | +0.10 | +0.61 |
Table 2. Chao Phraya Basin composite anomalies. Sources as Table 1.
For the 2026–27 EP event, this means the critical monitoring window for the Chao Phraya system is the JJA early monsoon — for early irrigation planning — and the MAM 2027 post-peak period, when EP El Niño produces approximately −96 mm rainfall anomaly combined with +0.71°C temperature excess. If the 2026 monsoon underperforms on early inflows, and reservoir recharge remains below target even in SON (which is less suppressed under EP than CP), the MAM 2027 demand period arrives against a compromised storage baseline. The two deficits compound, rather than being independent.
4.3 Northern Thailand — Heat signal dominates over rainfall
Northern Thailand (16–20°N, 98.5–101°E) presents a qualitatively different picture. Precipitation anomalies under EP El Niño are modest in all three seasonal windows — JJA approximately −1 mm, SON approximately −9 mm, MAM approximately −44 mm — and the EP–CP contrast in the post-1940 longer record collapses to approximately −6 mm in MAM. The rainfall discrimination between EP and CP El Niño is not robust enough in the north to serve as a primary agricultural indicator.
Temperature is a different story. Under EP El Niño, northern Thailand posts a MAM temperature anomaly of approximately +1.33°C — essentially the same magnitude as the Khorat Plateau and substantially larger than the CP MAM anomaly of +0.31°C. EP El Niño is also warmer than CP through JJA (+0.31°C vs. −0.17°C) and SON (+0.39°C vs. −0.06°C). The temperature signal is therefore consistent across the developing and post-peak phases, even while the rainfall signal remains ambiguous.
This has specific implications for northern Thai agriculture. Longan and lychee orchards, which dominate the upland agricultural economy of Chiang Rai and Chiang Mai, are sensitive to heat stress at flowering — a period that overlaps with the March–May risk window. Fire weather indices, which integrate temperature, humidity, and wind, are systematically elevated by the kind of broad, persistent warm anomaly that EP El Niño produces in the north. Upland maize and highland crop systems face accelerated evapotranspiration demand from soils that are already beginning the dry season depleted. The advisory for northern Thailand under an EP event is therefore not primarily a rainfall advisory. It is a heat, fire, and evaporative stress advisory.
The Delayed Impact Structure of EP El Niño
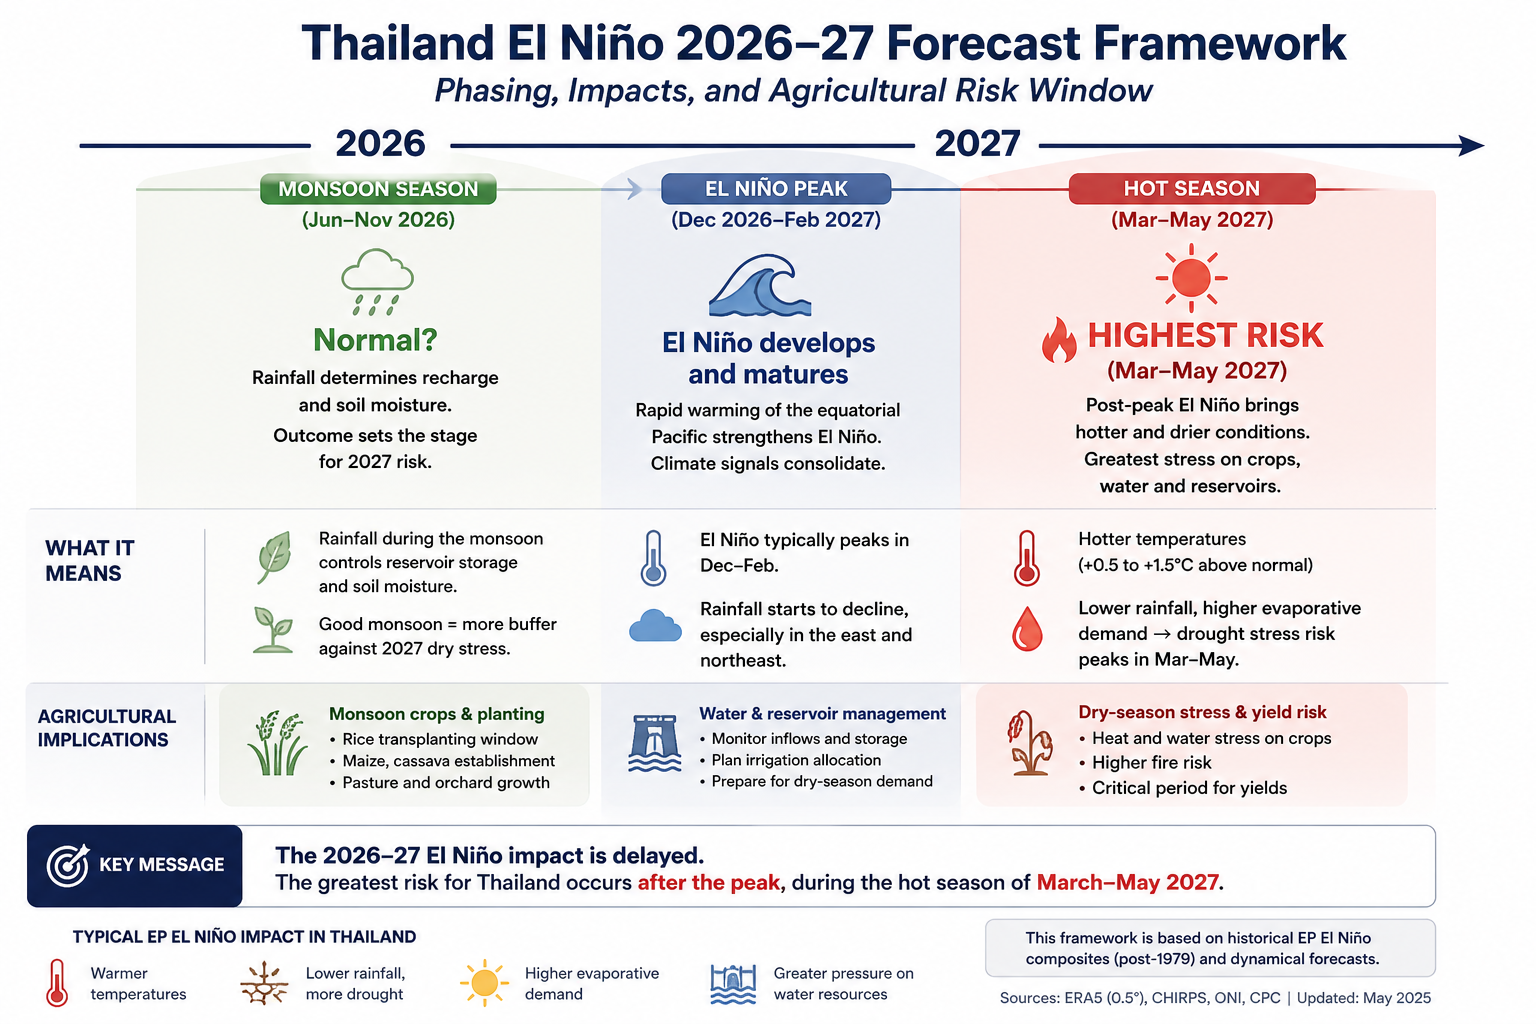
The phased framework in Figure 4 captures the central structural insight of this analysis. EP El Niño does not deliver its maximum agricultural stress during the developing season, nor at the event peak. It delivers a compounding hot–dry carryover in the season after the peak — when atmospheric forcing is weakening but the accumulated soil moisture deficit, reservoir storage gap, and persistent warm temperature anomaly combine to maximum effect.
This delayed structure is not unique to Thailand. It reflects the general behavior of ENSO teleconnections in the boreal spring following an El Niño winter peak, when the "spring persistence barrier" in ENSO predictability is associated with a characteristic regime of suppressed convection and anomalous anticyclonic flow over Southeast Asia.[12] For EP El Niño, this post-peak pattern is stronger and more consistent than for CP events, which tend to decay more rapidly and produce less persistent downstream anomalies in the subsequent spring.[3,10]
Phased Advisories for Three Agricultural Systems
The operational value of the EP–CP distinction lies not in naming the phenomenon but in naming the season when it becomes dangerous, and calibrating management responses to that timing. A blanket "El Niño brings drought" advisory — applied uniformly across the developing season — misframes the risk temporally and regionally, and may lead to preparedness action at the wrong time or in the wrong place.
Cassava fields planted in late 2026 or early 2027 on the Khorat Plateau will be entering the high-demand establishment phase — when root systems are shallow and water uptake capacity is limited — precisely at the peak of the EP post-peak hot–dry anomaly in March–May 2027. Planting-date management and soil-moisture monitoring in this window are the highest-priority agricultural interventions identified by this analysis.
For Chao Phraya reservoir operations, the September–November 2026 inflow period is the critical leading indicator. Under EP El Niño, SON is less suppressed than under CP (−29 mm vs. −85 mm), providing a relative advantage in recharge. However, if JJA 2026 early monsoon suppression (−72 mm) has already depleted antecedent storage, SON inflows may not compensate fully. The Royal Irrigation Department and EGAT should establish storage thresholds by November 2026 that trigger dry-season allocation decisions accounting for a likely MAM 2027 demand spike of +0.71°C evaporative excess and −96 mm rainfall deficit.
For northern Thailand, the most cost-effective preparedness investment is in fire weather monitoring and orchard heat-stress advisory systems, which can use temperature forecasts rather than precipitation forecasts as their primary input. The northern EP temperature signal (+1.33°C in MAM) is more consistent across the longer record than the rainfall signal, making it a more reliable trigger for heat-based agricultural advisories.
References
- Ropelewski, C.F. and Halpert, M.S. (1987). Global and regional scale precipitation patterns associated with the El Niño/Southern Oscillation. Monthly Weather Review, 115(8), 1606–1626.
- Trenberth, K.E. (1997). The definition of El Niño. Bulletin of the American Meteorological Society, 78(12), 2771–2777.
- Hu, W., Yang, S., and Cai, W. (2014). The physical distinction between EP and CP El Niño events and their downstream teleconnections. Journal of Climate, 27(21), 7986–8003. [Representative of the Hu–Yang–Cai physical characterization framework used in this report's composite design and event classification.]
- Ashok, K., Behera, S.K., Rao, S.A., Weng, H., and Yamagata, T. (2007). El Niño Modoki and its possible teleconnection. Journal of Geophysical Research: Oceans, 112(C11), C11007.
- Kug, J.-S., Jin, F.-F., and An, S.-I. (2009). Two types of El Niño events: Cold tongue El Niño and warm pool El Niño. Journal of Climate, 22(6), 1499–1515.
- Larkin, N.K. and Harrison, D.E. (2005). On the definition of El Niño and associated seasonal average U.S. weather anomalies. Geophysical Research Letters, 32(13), L13705. [Pioneering demonstration that "dateline" El Niño events produce distinct regional impacts and that pooled composites obscure regional signals; early work associated with Kingtse Mo and NOAA/CPC-era diagnostics.]
- Yeh, S.-W., Kug, J.-S., Dewitte, B., Kwon, M.-H., Kirtman, B.P., and Jin, F.-F. (2009). El Niño in a changing climate. Nature, 461(7263), 511–514. [Documents the apparent increase in CP El Niño frequency in recent decades and its possible link to greenhouse warming.]
- Lee, T. and McPhaden, M.J. (2010). Increasing intensity of El Niño in the central-equatorial Pacific. Geophysical Research Letters, 37(14), L14603.
- Zhou, Z.-Q., Xie, S.-P., Zheng, X.-T., Liu, Q., and Wang, H. (2014). Global warming–induced changes in El Niño teleconnections over the North Pacific and North America. Journal of Climate, 27(24), 9050–9064. [Global analysis confirming distinct land temperature and precipitation responses between EP and CP El Niño, with model projections suggesting contrasts may grow under warming.]
- Zhang, W., Jin, F.-F., Stuecker, M.F., Wittenberg, A.T., Timmermann, A., Ren, H.-L., Kug, J.-S., Cai, W., and Cane, M. (2016). Unraveling El Niño's impact on the East Asian Monsoon and Yangtze River summer flooding. Geophysical Research Letters, 43(21), 11375–11382. [Shows that EP and CP El Niño produce different East Asian summertime precipitation extremes during the decay phase, with distinct circulation responses involving the South Asia High and western Pacific subtropical high.]
- Wang, L., Chen, W., and Huang, R. (2008). Interdecadal modulation of PDO on the impact of ENSO on the East Asian winter monsoon. Geophysical Research Letters, 35(20), L20702. [Representative of work on ENSO diversity effects on East and South China precipitation structures under EP vs. CP events.]
- Webster, P.J. and Yang, S. (1992). Monsoon and ENSO: Selectively interactive systems. Quarterly Journal of the Royal Meteorological Society, 118(507), 877–926. [On post-peak ENSO decay and spring persistence, relevant to the delayed impact structure identified in Section 5.]